Table of Contents >> Show >> Hide
- What Counts as Renewable Energy in This 2025 State Ranking?
- Top States for Renewable Energy Production in 2025
- Texas: America’s Renewable Energy Heavyweight
- California: Solar Power With a Battery-Sized Asterisk
- Washington and Oregon: Hydropower Still Runs the Show
- Iowa, Oklahoma, Kansas, and the Great Plains Wind Belt
- New York and Illinois: Big Markets, Mixed Clean Power Profiles
- Florida and the Rise of Solar in High-Demand States
- Which States Had the Highest Renewable Share?
- Why Renewable Energy Production Varies So Much by State
- Wind, Solar, Hydro, Biomass, and Geothermal: The 2025 Mix
- What About Rooftop Solar?
- What 2025 Tells Us About the Future of Renewable Energy by State
- Experience Notes: What Renewable Energy Production Looks Like on the Ground
- Conclusion
Renewable energy production in the United States is no longer a polite side dish at the electricity dinner table. In 2025, it became a full-size entréeserved with a windy Texas brisket, a California solar salad, and a Washington hydropower dessert that has been on the menu for decades. The big story is simple: renewable electricity kept growing even while total U.S. power demand reached record levels.
This guide looks at renewable energy production by state in 2025, focusing on electricity generated from wind, solar, hydropower, geothermal, wood biomass, and other biomass. The ranking below is based on utility-scale net generation, which means large power plants connected to the grid. Rooftop solar matters tooquite a lotbut it is treated separately because small-scale systems are reported differently. In plain English: your neighbor’s shiny roof panels are awesome, but they are not counted in the main state table.
What Counts as Renewable Energy in This 2025 State Ranking?
For this article, “renewable energy production” means electricity produced from sources that naturally replenish over a short period of time. That includes wind turbines, solar farms, hydropower dams, geothermal plants, and biomass facilities. It does not include nuclear power, even though nuclear is carbon-free, because nuclear fuel is not classified as renewable. It also excludes pumped-storage hydro from the renewable total because pumped storage is mainly an energy-storage system, not a primary source of new renewable generation.
The difference matters. A state can look like a clean-power superstar if it has massive hydropower resources, while another may be racing ahead in solar but still producing a smaller share of total electricity from renewables because demand is enormous. Texas is the perfect example: it generated more renewable electricity than any other state in 2025, yet renewables made up a smaller percentage of its total generation than in states such as Washington, Oregon, Iowa, South Dakota, Vermont, and Idaho.
Top States for Renewable Energy Production in 2025
When measured by total utility-scale renewable electricity generation, the 2025 leaders show how geography, policy, infrastructure, and plain old weather shape America’s clean power map. Wind dominates the Great Plains and Texas. Solar shines across California, Florida, Arizona, Nevada, and increasingly the Southeast. Hydropower still makes the Pacific Northwest look like it installed a giant battery in the mountains before batteries were cool.
| Rank | State | Renewable Generation, 2025 | Renewable Share of State Power | Leading Renewable Source |
|---|---|---|---|---|
| 1 | Texas | 190.3 million MWh | 32.2% | Wind |
| 2 | California | 114.9 million MWh | 55.8% | Solar |
| 3 | Washington | 75.5 million MWh | 73.3% | Hydropower |
| 4 | Iowa | 46.4 million MWh | 62.5% | Wind |
| 5 | Oregon | 42.5 million MWh | 65.8% | Hydropower |
| 6 | Oklahoma | 40.8 million MWh | 44.9% | Wind |
| 7 | New York | 39.5 million MWh | 29.9% | Hydropower |
| 8 | Illinois | 31.8 million MWh | 16.5% | Wind |
| 9 | Kansas | 30.2 million MWh | 47.9% | Wind |
| 10 | Florida | 28.4 million MWh | 10.6% | Solar |
Texas: America’s Renewable Energy Heavyweight
Texas led the country in renewable energy production in 2025, generating about 190.3 million megawatt-hours from utility-scale renewable sources. Most of that came from wind, with solar rising quickly behind it. Texas is not the state people once associated with “green energy” at dinner parties, but the grid does not care about stereotypes. It cares about land, wind speed, sunshine, transmission lines, and developers who can build at scale. Texas has all of those, plus a competitive electricity market that can move fast when economics make sense.
The Texas story is also a reminder that renewable leadership is not always driven by political branding. Wind farms in West Texas and the Panhandle have become industrial-scale power producers because they work. Solar is now expanding for the same reason. A rancher, a grid operator, and an accountant may disagree on many things, but when a project produces cheap electricity, the conversation gets friendlier.
California: Solar Power With a Battery-Sized Asterisk
California ranked second in total utility-scale renewable generation in 2025, with about 114.9 million megawatt-hours. Solar was the state’s leading renewable source, followed by wind, geothermal, biomass, and hydropower. California’s clean energy profile is more diverse than many people realize. The state is famous for solar panels, yes, but it also has geothermal resources in places like the Imperial Valley and long-running wind farms in mountain passes.
California’s challenge is not whether it can produce solar electricity. It can. The trick is matching that production with demand after the sun clocks out for the day. That is why battery storage has become so important. Solar without storage is like making a great lunch and then realizing dinner guests arrive at 7 p.m. Batteries help move some of that midday electricity into the evening, when air conditioners, lights, appliances, and streaming services all raise their hands at once.
Washington and Oregon: Hydropower Still Runs the Show
Washington produced about 75.5 million megawatt-hours of renewable electricity in 2025, and Oregon produced about 42.5 million. In both states, hydropower remained the foundation. This is not a new trend, but it is still one of the most important regional differences in the U.S. renewable map. The Columbia River system and other major waterways give the Pacific Northwest a renewable advantage that many states cannot copy, unless they happen to have a spare river basin in the garage.
Hydropower also behaves differently from wind and solar. It can be dispatchable in many cases, meaning operators have more control over when electricity is produced. However, it is also affected by snowpack, rainfall, drought, environmental rules, fish passage requirements, and competing water uses. Hydropower is renewable, but it is not magic. It still depends on nature paying the water bill.
Iowa, Oklahoma, Kansas, and the Great Plains Wind Belt
Iowa, Oklahoma, and Kansas were among the strongest wind states in 2025. Iowa generated about 46.4 million megawatt-hours from renewables, with wind doing nearly all the heavy lifting. Kansas produced about 30.2 million megawatt-hours from renewables, again led overwhelmingly by wind. Oklahoma generated about 40.8 million megawatt-hours, with wind as the clear star.
These states prove that renewable energy is not only a coastal story. In fact, the Great Plains may be the closest thing the United States has to a renewable electricity factory floor. Wide-open spaces, strong wind resources, and large projects allow turbines to operate at impressive scale. The limiting factor is often not resource quality but transmission capacity: getting electricity from windy rural areas to cities and industrial loads that need it.
New York and Illinois: Big Markets, Mixed Clean Power Profiles
New York generated about 39.5 million megawatt-hours of renewable electricity in 2025, led by hydropower. Upstate hydro resources are a long-standing advantage, while solar and wind continue to expand. New York also has aggressive clean energy goals, which means future growth will depend on transmission upgrades, offshore wind development, siting decisions, and how quickly projects can move from paperwork to actual electrons.
Illinois ranked eighth in total renewable generation, producing about 31.8 million megawatt-hours. Wind led the state’s renewable mix. Illinois is also a major nuclear power state, which lowers its power-sector carbon intensity, but nuclear is not counted as renewable in this ranking. That distinction is important for readers comparing “renewable electricity” with “clean electricity.” They sound similar at a barbecue, but in energy policy, they are not twins.
Florida and the Rise of Solar in High-Demand States
Florida entered the top ten in 2025 with about 28.4 million megawatt-hours of renewable electricity, mostly from solar. The Sunshine State finally appears to be taking its nickname seriously. Yet renewables made up only about 10.6% of Florida’s total electricity generation because the state’s overall power demand is huge. Air conditioning alone could probably qualify as a state mascot.
Florida’s solar growth shows an important national pattern: states with high electricity demand can add enormous amounts of solar and still have a modest renewable share. That does not mean the growth is small. It means the denominator is large. In energy analysis, the denominator is where many hot takes go to quietly retire.
Which States Had the Highest Renewable Share?
Total production is one way to rank states, but percentage share tells another story. Vermont, South Dakota, Washington, Idaho, Oregon, Iowa, Maine, Montana, California, and New Mexico all stood out for high renewable shares in 2025. Some of those states have small total electricity markets, so their percentages can look dramatic. Others, like California and Washington, combine large generation volumes with high renewable penetration.
South Dakota is especially interesting because wind gives it a very high renewable share. Vermont is unusual because its small in-state generation base makes renewable output account for nearly all electricity produced within the state, though Vermont also imports power. The lesson: state electricity rankings are useful, but they should be read with context. A tiny plate can look full with one sandwich; Texas needs the whole buffet.
Why Renewable Energy Production Varies So Much by State
1. Geography Still Has a Vote
Wind turbines prefer steady wind, solar panels prefer sunshine, hydropower prefers flowing water, and geothermal plants prefer underground heat. This sounds obvious, but it explains a lot. The Great Plains dominate wind. The Southwest and Sun Belt are strong in solar. The Pacific Northwest leads in hydropower. California and Nevada have geothermal advantages. Renewable energy may be high-tech, but it still starts with nature’s personality.
2. Transmission Can Make or Break Growth
Renewable resources are often located far from major population centers. That creates a practical problem: electricity needs a road. Transmission lines are those roads, and in many regions the roads are crowded, outdated, or not built yet. A great wind site without transmission is like a food truck parked in the desert with no highway nearby. The tacos may be excellent, but nobody can get them.
3. State Policy Shapes Investment
Renewable portfolio standards, clean energy standards, tax incentives, net metering rules, permitting systems, and utility planning all influence how fast projects get built. Some states require utilities to supply a certain share of electricity from renewable or clean sources. Others rely more heavily on market economics. The most successful states usually combine good resources with workable rules and enough grid infrastructure to move power where it is needed.
4. Demand Growth Changes the Math
In 2025, U.S. electricity demand continued rising, helped by data centers, manufacturing, electrification, and ordinary population growth. Renewable generation can grow quickly and still struggle to increase its percentage share if total demand grows at the same time. This is why capacity additions, generation totals, and renewable share should be analyzed together. One number alone is rarely the whole movie; at best, it is the trailer.
Wind, Solar, Hydro, Biomass, and Geothermal: The 2025 Mix
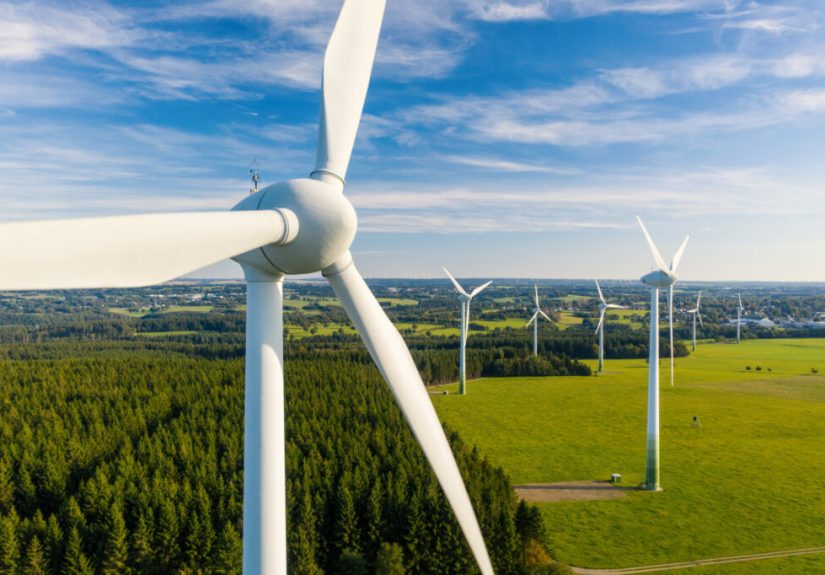
Wind remained the largest utility-scale renewable source in the United States in 2025. It powered the renewable rankings in Texas, Iowa, Oklahoma, Kansas, Illinois, and several other central states. Solar was the fastest-growing major renewable technology, especially in Texas, California, Florida, Arizona, Nevada, North Carolina, Georgia, and Virginia. Hydropower stayed crucial in Washington, Oregon, Idaho, New York, and Montana.
Biomass played a smaller but still meaningful role, especially in states with forestry, agriculture, landfill gas, or industrial organic waste resources. Geothermal remained concentrated in the West, particularly California, Nevada, Utah, and Hawaii. Unlike solar panels and wind turbines, geothermal plants are not something every state can simply decide to build at scale. You need the right underground conditions. Unfortunately, “please be geothermally interesting” is not yet a successful economic development strategy.
What About Rooftop Solar?
Rooftop and other small-scale solar systems are a major part of the clean energy story, especially in states such as California, Arizona, New Jersey, Massachusetts, Hawaii, New York, and Florida. Nationally, small-scale solar generated roughly 93,000 gigawatt-hours in 2025. That is large enough to change the overall solar picture, but because it is estimated and reported separately from utility-scale plant generation, it is not included in the main state table above.
This means solar-heavy states may be even more renewable than the utility-scale numbers suggest. Rooftop solar also changes how customers interact with the grid. A home or business with solar can become both a consumer and a producer. That makes electricity planning more complex, but also more flexible. The grid of the future is less like a one-way street and more like a neighborhood potluck, except everyone brought electrons.
What 2025 Tells Us About the Future of Renewable Energy by State
The 2025 renewable energy map shows that the U.S. transition is not happening evenly. It is happening according to local resources, grid rules, market structures, policy choices, and demand growth. Texas leads in total volume because it can build huge wind and solar projects. California leads in solar sophistication and storage urgency. Washington and Oregon continue to rely on hydropower. Iowa, Kansas, Oklahoma, and the Dakotas show how wind can transform state electricity systems.
The next phase will depend heavily on transmission, storage, permitting, and local acceptance. Building renewable projects is no longer the strange new idea. The bigger challenge is integrating them smoothly while keeping electricity reliable and affordable. That means modern grid planning, faster interconnection queues, smarter demand response, and better coordination between utilities, regulators, developers, and communities.
Experience Notes: What Renewable Energy Production Looks Like on the Ground
Renewable energy sounds abstract until you stand near it. A wind farm in the Great Plains is not just a collection of white towers; it is a landscape where old and new economies overlap. You may see cattle grazing under turbines, service trucks moving along gravel roads, and small towns discussing lease payments, tax revenue, school funding, and whether the blinking red lights at night are charming or mildly annoying. Energy policy becomes very real when it is visible from the kitchen window.
Solar country feels different. Utility-scale solar farms are quieter, lower to the ground, and often more visually modest than people expect. From a distance, a large solar project can look like a dark lake that forgot how to ripple. Up close, it becomes rows of panels, inverters, fencing, access roads, and maintenance crews checking equipment. In hot states such as Arizona, Texas, Florida, and California, the connection between sun and electricity feels almost too obvious. The sun is already working overtime; solar simply hands it a timesheet.
Hydropower regions have their own personality. In Washington and Oregon, renewable electricity is tied to rivers, dams, reservoirs, salmon, irrigation, flood control, recreation, and decades of regional planning. Hydropower is not just an energy source there; it is part of the civic furniture. People may not talk about it every day, but it quietly supports the grid in the background. It is the dependable friend who arrives early, brings tools, and does not ask for applause.
Communities also experience renewable energy through jobs and local revenue. Wind technicians, solar installers, electricians, engineers, construction workers, environmental consultants, landowners, county officials, and grid operators all become part of the story. In some counties, renewable projects help fund schools or public services. In others, debates over land use, wildlife, viewsheds, or local control can become intense. Clean energy may reduce emissions, but it does not eliminate the need for good neighbor manners.
For everyday electricity customers, the experience is usually less dramatic: the lights turn on, the phone charges, the refrigerator hums, and nobody throws a parade for the electrons. But behind that ordinary moment is a fast-changing power system. A kilowatt-hour used in Dallas, Des Moines, Seattle, Los Angeles, or Miami may increasingly come from wind, sun, water, biomass, or geothermal heat. The renewable energy transition is not one national story; it is fifty state stories plus the District of Columbia, each with its own weather report, rulebook, and personality.
Conclusion
Renewable energy production by state in 2025 reveals a country moving quickly, but not uniformly. Texas generated the most renewable electricity overall, California remained the solar giant, Washington and Oregon leaned on hydropower, and the Great Plains continued turning wind into serious grid power. The states with the highest renewable percentages were not always the biggest producers, which is why both total generation and renewable share matter.
The next winners will likely be states that combine strong resources with faster permitting, better transmission, affordable storage, and policies that make investment predictable. Renewable energy is no longer a futuristic postcard. It is already a major part of the American power systemand in 2025, it grew up enough to start paying rent.