Table of Contents >> Show >> Hide
- What Is a Diode Clipping Circuit?
- What Are Transfer Characteristics?
- Why Transfer Characteristics Matter in Diode Clippers
- Basic Diode Models Used for Drawing
- The Most Common Basic Circuit: A Shunt Positive Clipper
- How to Draw the Transfer Characteristics Step by Step
- Example 1: Positive Diode Clipper
- Example 2: Negative Diode Clipper
- Example 3: Biased Positive Clipper
- Example 4: Double Diode Clipper
- Common Mistakes When Drawing Diode Clipper Transfer Curves
- Practical Tips for Lab Work
- How to Explain the Transfer Curve in Words
- Experience Notes: What Drawing Diode Clipper Transfer Characteristics Teaches You
- Conclusion
Drawing the transfer characteristics for a basic diode clipping circuit sounds like one of those tasks invented by a professor who owns too much graph paper. But once you understand what the graph is actually saying, it becomes surprisingly friendly. A transfer characteristic is simply a plot of output voltage versus input voltage. In other words, it answers one practical question: “If I feed this circuit a certain input voltage, what output voltage should I expect?”
For a diode clipping circuit, that question is especially useful because the output does not always follow the input. Sometimes it behaves politely and copies the input almost exactly. Other times the diode wakes up, conducts current, and says, “That is enough voltage, thank you very much.” The result is a clipped waveform and a transfer curve with clear breakpoints.
This guide explains how to draw the transfer characteristics for a basic diode clipping circuit using simple steps, practical examples, and a little humor, because electrons may be serious, but we do not have to be.
What Is a Diode Clipping Circuit?
A diode clipping circuit, also called a diode limiter, is a wave-shaping circuit that removes or limits part of an input signal. Instead of amplifying the signal or shifting its entire DC level, a clipper prevents the output from going above or below a selected voltage level.
The most basic diode clipper uses a resistor and a diode. The resistor limits current, while the diode controls when the circuit changes behavior. When the diode is reverse-biased or below its conduction threshold, it acts almost like an open switch. When it is forward-biased, it conducts and clamps the output near a fixed voltage.
That ON/OFF behavior is exactly why the transfer characteristic is usually drawn as a piecewise graph. The graph has one region where the diode is OFF and another region where the diode is ON.
What Are Transfer Characteristics?
The transfer characteristic of a circuit is a graph of Vout on the vertical axis versus Vin on the horizontal axis. It is not a time-domain waveform. A sine wave plot shows how voltage changes with time. A transfer curve shows how the circuit maps every possible input voltage to an output voltage.
Think of it as the circuit’s personality profile. If the circuit is linear, the graph may be a straight diagonal line. If the circuit contains a diode, the graph usually has bends, flat sections, or clipping limits. These bends tell you exactly where the diode changes state.
Why Transfer Characteristics Matter in Diode Clippers
Transfer characteristics help you understand a diode clipping circuit without guessing from a waveform alone. Once the transfer curve is known, you can predict what happens to a sine wave, triangle wave, audio signal, sensor signal, or pulse train.
For example, if a transfer curve rises diagonally until +0.7 V and then becomes flat, you immediately know the output is limited near +0.7 V. If the graph is flat below -0.7 V and diagonal above that, the circuit clips negative voltage peaks. The curve is like a map: once you have it, the waveform has fewer places to hide.
Basic Diode Models Used for Drawing
1. Ideal Diode Model
In the ideal diode model, the diode is treated as a perfect switch. When forward-biased, it conducts with zero voltage drop. When reverse-biased, it is an open circuit. This model is easy for first sketches because the clipping level is exactly at 0 V or at the applied reference voltage.
2. Constant Voltage Drop Model
In practical circuit analysis, a silicon diode is often approximated as having a forward voltage drop of about 0.7 V. A Schottky diode may have a lower drop, commonly around 0.2 V to 0.4 V, depending on current and device type. The exact value is not magic; it depends on the diode, current, and temperature. Still, the constant voltage model is very useful for hand-drawn transfer characteristics.
3. Real Diode Model
A real diode does not suddenly jump from OFF to ON like a tiny electronic superhero. Its current increases gradually according to its current-voltage relationship. For most introductory clipping circuit sketches, however, the ideal or constant voltage drop model is enough. Use the real diode model when accuracy matters, such as simulation, precision design, or lab measurements.
The Most Common Basic Circuit: A Shunt Positive Clipper
Consider a basic shunt positive clipping circuit. The input voltage passes through a resistor to the output node. A diode is connected from the output node to ground so that it becomes forward-biased when the output tries to rise above the diode’s forward voltage.
When Vin is below the diode threshold, the diode is OFF. Since almost no current flows through the resistor, there is almost no voltage drop across it, so:
Vout = Vin
When Vin tries to rise above approximately +0.7 V for a silicon diode, the diode conducts and clamps the output near:
Vout ≈ +0.7 V
Therefore, the transfer characteristic becomes:
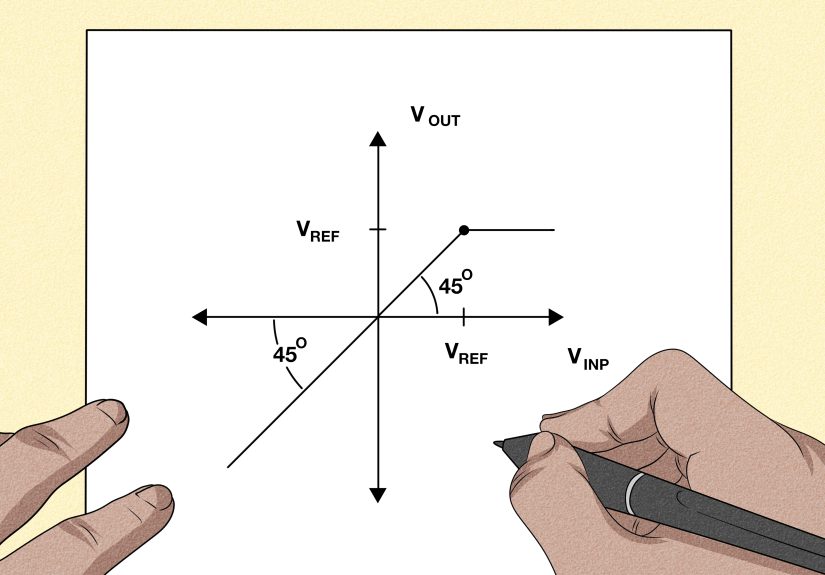
The graph is a diagonal line with slope 1 until +0.7 V, followed by a horizontal line at Vout = +0.7 V. That horizontal section is the clipped region.
How to Draw the Transfer Characteristics Step by Step
Step 1: Identify the Circuit Type
First, decide whether the circuit clips positive peaks, negative peaks, or both. Look at the diode direction. If the diode conducts when the output node becomes too positive, it is a positive clipper. If it conducts when the output node becomes too negative, it is a negative clipper. If there are two opposite diodes or biased branches, the circuit may clip both sides.
Step 2: Choose a Diode Model
Decide whether to use the ideal model or the constant voltage drop model. For quick classroom sketches, the ideal model gives a clean breakpoint at 0 V. For practical silicon diode examples, use about 0.7 V. Always follow the model specified in your textbook, lab manual, or exam question.
Step 3: Find the Diode Switching Point
The switching point is the input voltage where the diode changes from OFF to ON. For an unbiased shunt positive clipper using a silicon diode, this occurs when the output tries to exceed about +0.7 V. Since the output follows the input before conduction, the breakpoint is approximately:
Vin = +0.7 V
If a DC bias source is added, include it in the threshold. For example, a positive clipper with a +3 V reference and a silicon diode may clip near:
Vclip = 3 V + 0.7 V = 3.7 V
Step 4: Write the OFF-State Equation
When the diode is OFF, replace it with an open circuit. In a basic shunt clipper, no current flows through the diode branch. If the output is taken at the node after the resistor and there is no heavy load, the output follows the input:
Vout = Vin
This gives the diagonal part of the transfer curve.
Step 5: Write the ON-State Equation
When the diode is ON, replace it with a voltage drop. For a silicon diode, the conducting diode holds the output near the clipping voltage. In the basic positive clipper:
Vout ≈ +0.7 V
This gives the horizontal part of the transfer curve.
Step 6: Draw the Axes
Draw Vin on the horizontal axis and Vout on the vertical axis. Label both axes clearly. Do not make the classic mistake of drawing output versus time. That is a waveform, not a transfer characteristic. It is a fine graph, but it has wandered into the wrong classroom.
Step 7: Plot the Piecewise Regions
Start with the OFF-state region. Draw a straight diagonal line where Vout = Vin. Then draw the ON-state region as a flat line at the clipping voltage. Mark the breakpoint clearly, such as (+0.7 V, +0.7 V).
Step 8: Check the Diode State
Finally, verify that your assumptions make sense. In the OFF region, the diode should not be forward-biased. In the ON region, the current should flow in the diode’s forward direction. If the graph says the diode is conducting backward, the circuit has not discovered time travel; the sketch is probably wrong.
Example 1: Positive Diode Clipper
Suppose a silicon diode clips the positive side of the output signal. Using the constant voltage model:
The transfer curve begins as a diagonal line for negative voltages and small positive voltages. At +0.7 V, it bends and becomes horizontal. If the input is a 5 V peak sine wave, the output will follow the sine wave until it reaches about +0.7 V. Above that, the top of the waveform is clipped flat.
Example 2: Negative Diode Clipper
Now reverse the diode so it conducts when the output goes too negative. The diode turns ON when the output attempts to go below about -0.7 V. The transfer characteristic becomes:
This time, the graph is horizontal at -0.7 V for large negative inputs, then becomes diagonal after the breakpoint. A sine wave passing through this circuit keeps its positive half mostly unchanged, while the negative peaks are flattened.
Example 3: Biased Positive Clipper
A biased clipper uses a DC source to move the clipping level away from the diode’s natural forward voltage. Suppose you want to clip the output near +4.7 V. You can use a +4 V reference source in series with a silicon diode. The approximate clipping level is:
Vclip = 4 V + 0.7 V = 4.7 V
The transfer characteristic is:
This is useful when the circuit should allow normal signal swings but prevent dangerously high voltage levels from reaching a sensitive input.
Example 4: Double Diode Clipper
A double diode clipper limits both positive and negative extremes. Suppose one diode clips at +3.7 V and the other clips at -2.7 V. The transfer characteristic becomes:
The graph has three regions: a lower horizontal clipping line, a middle diagonal line, and an upper horizontal clipping line. This type of circuit is common in signal protection and wave shaping, where the goal is to keep voltage within a safe range.
Common Mistakes When Drawing Diode Clipper Transfer Curves
Mistake 1: Confusing the Time Waveform with the Transfer Curve
A waveform graph uses time on the horizontal axis. A transfer characteristic uses input voltage on the horizontal axis. If your x-axis says “time,” you are drawing a different graph.
Mistake 2: Forgetting the Diode Voltage Drop
If the problem says to use a silicon diode model, do not clip at 0 V unless the ideal diode model is specified. Use approximately 0.7 V, or the value given in the question.
Mistake 3: Drawing the Flat Region on the Wrong Side
The flat part of the transfer curve appears where the diode is conducting. For a positive clipper, that is usually at high positive input values. For a negative clipper, it is usually at high negative input values.
Mistake 4: Ignoring Bias Voltage Polarity
Bias sources shift the clipping level, but polarity matters. A reversed reference source can move the threshold in the opposite direction. Always trace the diode branch carefully before writing the clipping voltage.
Practical Tips for Lab Work
In the lab, the transfer characteristic can often be viewed using an oscilloscope in X-Y mode. One channel represents the input voltage and the other represents the output voltage. Instead of seeing voltage versus time, you see the circuit’s input-output relationship directly.
Real measurements may not show perfectly sharp corners. The diode transition is gradual, the resistor and load affect current, and the diode forward voltage changes with current and temperature. That does not mean your circuit is broken. It means reality has arrived wearing safety goggles.
How to Explain the Transfer Curve in Words
A good written explanation should identify the diode state in each region. For a positive clipper, you might write:
“For input voltages below the diode threshold, the diode is OFF and the output follows the input. When the input attempts to drive the output above the diode forward voltage, the diode turns ON and clamps the output near the clipping level.”
That short explanation shows that you understand both the graph and the circuit operation. It is much better than simply drawing a mysterious flat line and hoping the grader is in a generous mood.
Experience Notes: What Drawing Diode Clipper Transfer Characteristics Teaches You
The first time many students draw the transfer characteristics for a basic diode clipping circuit, they treat it like a memorization exercise. Positive clipper, flat top. Negative clipper, flat bottom. Add 0.7 V somewhere. Pray. Submit. But the real value comes when you stop memorizing shapes and start reading the circuit like a story.
One helpful experience is to physically trace current paths with your finger. When the diode is OFF, ask yourself where current can actually go. In a simple shunt clipper with no heavy load, the answer is often “almost nowhere,” which explains why the output follows the input. When the diode turns ON, suddenly there is a path to ground or to a reference voltage. That path controls the output node. Once you see that, the flat line on the graph feels less like a rule and more like common sense.
Another useful habit is to make a small table before drawing the graph. Pick three input values: one clearly below the clipping level, one near the breakpoint, and one clearly beyond it. For a positive silicon clipper, try -2 V, +0.7 V, and +3 V. The outputs will be approximately -2 V, +0.7 V, and +0.7 V. Those three points practically draw the curve for you. It is like giving your pencil GPS.
Lab work adds another layer of understanding. On paper, the corner of the transfer curve may look perfectly sharp. On an oscilloscope, the bend is often rounded. That is because a real diode does not switch instantly from open circuit to perfect conductor. Its forward voltage also depends on current. If the resistor value changes, the diode current changes, and the measured clipping level may shift slightly. This is not a failure; it is the circuit politely reminding you that models are simplifications.
Bias supplies can be confusing at first, especially when their polarity is drawn in a way that looks backwards. A good experience-based trick is to ignore the whole circuit for a moment and focus only on the diode branch. Ask: “What output voltage would make this diode just begin to conduct?” Include the bias source and diode drop in that path. That voltage is your breakpoint. Once the breakpoint is known, the rest of the transfer characteristic is usually easy.
Finally, drawing transfer characteristics builds intuition for larger electronics topics. Clippers appear in signal protection, communication circuits, audio distortion circuits, rectifiers, and digital input protection. The same ON/OFF diode reasoning also helps with clamps, Zener regulators, logic circuits, and power supply protection. A basic diode clipper may look humble, but it teaches a powerful lesson: nonlinear circuits become manageable when you divide them into operating regions. That skill is worth far more than one neat graph.
Conclusion
To draw the transfer characteristics for a basic diode clipping circuit, identify the diode orientation, choose a diode model, determine the switching threshold, write the output equation for each diode state, and plot Vout versus Vin. For a simple positive silicon clipper, the output follows the input until about +0.7 V, then remains nearly constant. For a negative clipper, the same idea applies below about -0.7 V. With biased clippers, the reference voltage shifts the clipping level.
Once you master this method, diode clipping circuits stop looking like random diode art and start looking like logical, predictable signal-shaping tools. The curve is not just a graph; it is the circuit’s operating rulebook.