Table of Contents >> Show >> Hide
- The Number of the Day: 5.8% (and Why It Matters)
- How the Pandemic Pushed CO2 Down (Without Asking Nicely)
- The “Rebound” Problem: CO2 Fell, Then Remembered Its Old Habits
- Why the Air Looked Cleaner but the Atmosphere Didn’t “Reset”
- What 2020 Proved: Big CO2 Cuts Are PossibleIf We Target the Right Systems
- A Quick “Number of the Day” Scoreboard (Because Numbers Are Fun)
- Conclusion: Don’t Romanticize the DropLearn From It
- Experiences People Commonly Associate With 2020’s CO2 Dip (About )
If your brain enjoys “Number of the Day” trivia, here’s one that’s equal parts fascinating and
mildly uncomfortable: in 2020, global energy-related carbon dioxide (CO2) emissions dropped by
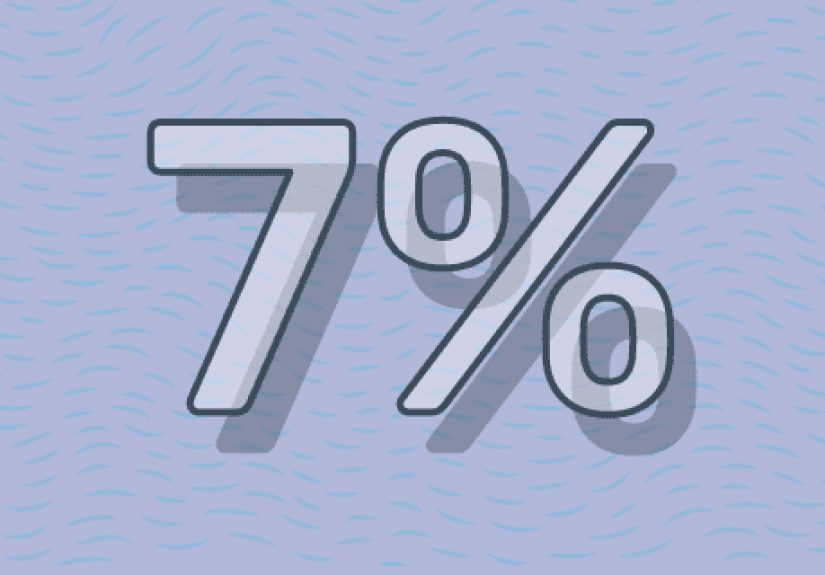
about 5.8%. That’s not a rounding error. That’s the biggest annual percentage decline in
decadesso big it’s been described as roughly the same as wiping the European Union’s emissions off the
ledger for a year.
Before we get too tempted to call 2020 a “climate win,” let’s be real: the pandemic wasn’t a policy,
it was a crisis. Emissions fell because planes stayed grounded, commutes evaporated, and parts of the
economy hit the pause button. Then, as soon as the world started moving again, the carbon math started
moving with it.
Still, the dip is worth studyingbecause it reveals something important: when we change how we move,
power our buildings, and run industry, CO2 responds fast. The question is whether we can keep the good
parts (cleaner energy, fewer wasteful miles, smarter buildings) without keeping the bad parts (global
disruption, illness, and economic pain). Spoiler: yesif we stop treating decarbonization like a “nice
to have” and start treating it like basic infrastructure.
The Number of the Day: 5.8% (and Why It Matters)
Let’s translate the headline number into human terms. A 5.8% drop in global energy-related CO2 in 2020
means emissions fell by roughly two billion metric tons compared with the year before. In climate
terms, that’s enormousyet it still didn’t “fix” the problem. Why? Because the world emits so much CO2
every year that even historic drops only dent the curve unless they’re repeated and sustained.
Think of the atmosphere like a bathtub with the faucet running. In 2020, we turned the faucet down
for a moment. We did not turn it off. And the tub is still filling because CO2 accumulates over time.
The “Number of the Day” is a reminder that we’re dealing with a stock-and-flow problem: yearly
emissions are the flow; atmospheric CO2 concentration is the stock.
The 2020 decline also had a hidden message: a big chunk of our emissions is tied to everyday activity
commuting, flying, heating offices, manufacturing goods. When those activities changed suddenly, emissions
changed suddenly too. That’s useful information for anyone designing climate policy that doesn’t rely on
wishful thinking and vibes.
How the Pandemic Pushed CO2 Down (Without Asking Nicely)
CO2 doesn’t care about our intentions. It responds to fuel burned and electricity generated. The pandemic
reduced both by disrupting the biggest “emissions engines” of modern life: transportation, buildings, and
industry. Here’s what that looked like in practice.
1) Transportation Hit the Brakes
Transportation is a climate heavyweight. In the U.S., it’s widely cited as the largest source of direct
greenhouse gas emissions. So when mobility dropped, CO2 had no choice but to follow.
Aviation is the most dramatic example because the collapse was visible in real time: empty airports,
ghost-town terminals, and those luggage carousels spinning like they were practicing for the Olympics.
U.S. DOT data show domestic passenger flights in 2020 fell by about 41% compared with 2019, and seat
occupancy dropped sharply as well.
Driving also fellhard. Preliminary federal data cited by safety agencies show vehicle miles traveled in
2020 decreased by about 13% from 2019. Fewer miles driven generally means less gasoline burned,
which generally means fewer tailpipe emissions. (Yes, it’s “generally,” because congestion patterns and
driving behavior also matterbut the overall direction is clear.)
The key insight isn’t “lockdowns reduce CO2.” The key insight is that mobility patterns are incredibly
influential. If we can replace a meaningful share of miles with cleaner alternativeselectric vehicles,
public transit that’s actually convenient, safer biking and walking infrastructure, and fewer forced
commutesthen emissions can fall without society falling apart.
2) Offices Dimmed, Homes Lit Up
The pandemic didn’t eliminate energy use; it rearranged it. Think of all the office towers that suddenly
stopped running HVAC for thousands of people, while millions of homes started running air conditioners,
heaters, laptops, and kitchen appliances all day.
In the United States, energy-related CO2 emissions declined by about 11% in 2020, according to federal
energy statistics. Part of that drop reflects reduced commercial activity and a shift in electricity demand.
But it also reflects something bigger that was already underway: electricity getting less carbon-intensive
over time as coal use declines and cleaner sources grow.
Here’s the practical takeaway: buildings are a massive lever. Energy efficiency, better insulation, smarter
thermostats, heat pumps, and a cleaner grid can cut emissions without asking people to “use less comfort.”
It’s not about freezing in the dark. It’s about getting the same comfort with less carbon.
3) Industry Slowed (But Didn’t Disappear)
Manufacturing and construction didn’t vanish in 2020, but many sectors slowed. Reduced travel demand meant
reduced fuel demand; disrupted supply chains reduced industrial activity; and uncertainty delayed projects.
All of that reduced fossil fuel combustion and the associated emissions.
But the industrial story also shows why temporary slowdowns aren’t a solution. As soon as production ramps up
again, emissions ramp up unless the underlying process changesthink cleaner electricity for industrial heat,
improved efficiency, alternative fuels, and (in some sectors) carbon capture paired with real emissions cuts.
The “Rebound” Problem: CO2 Fell, Then Remembered Its Old Habits
If 2020 was the great pause, late 2020 and 2021 were the great “okay, back to business.” International energy
data showed that by December 2020, global energy-related CO2 emissions were already higher than the same month
a year earlierbecause recovery started and because not all recovery was “clean.”
This rebound matters because it highlights a common climate trap: confusing a one-time event with a structural
shift. A structural shift is when emissions fall because the economy becomes less carbon-intensive
cleaner power, electrified transport, efficient buildings, and industrial innovation. A one-time event is when
emissions fall because nobody is allowed to go anywhere and half your favorite restaurants are closed.
If the “Number of the Day” teaches anything, it’s this: emissions can move fast, but they don’t stay down on
their own. The system defaults to “burn fuel, emit CO2” unless we redesign the system.
Why the Air Looked Cleaner but the Atmosphere Didn’t “Reset”
Many people remember 2020 as the year the sky looked differentclearer city skylines, less haze, fewer exhaust
smells. That observation is real, but it’s not the same as “the CO2 problem is fixed.”
Satellites and models detected sharp changes in nitrogen dioxide (NO2) over major cities as lockdowns took
effect. NO2 is tied closely to vehicle and industrial combustion, and it can drop quickly when traffic falls.
That’s why you can see it from space.
CO2 is different. It’s a long-lived gas, and it accumulates. Even with reduced emissions, atmospheric CO2 can
continue risingjust a bit more slowlybecause the world is still emitting billions of tons each year.
Observations at Mauna Loa, Hawaii show the annual mean CO2 concentration in 2020 was about 414 ppm,
continuing the long-term upward trend. Measurements also reached seasonal peaks above 417 ppm in 2020.
If NO2 is like smoke that clears when the fire dies down, CO2 is like heat stored in the wallsslow to build,
slow to leave. That’s why climate progress is measured in sustained cuts, not single-year dips.
What 2020 Proved: Big CO2 Cuts Are PossibleIf We Target the Right Systems
The pandemic’s emissions drop wasn’t “good,” but it was informative. It showed where emissions are
concentrated and what happens when those systems shift. Here are the lessons worth keeping.
Lesson A: Clean Electricity Is the Backbone
Every electrification strategyelectric cars, heat pumps, electric industrial processesworks best when the
grid is getting cleaner. If electricity is generated by coal, electrification helps less. If electricity is
generated by renewables, nuclear, and lower-carbon sources, electrification becomes a multiplier.
That’s why building clean power and modernizing transmission isn’t just “energy policy.” It’s transportation
policy, housing policy, and industrial policy all at once.
Lesson B: Transportation Emissions Are a Design Problem
People didn’t “become virtuous” in 2020. They stayed home because they had to. But the resultfewer miles and
fewer flightsshows how sensitive emissions are to mobility. In a world of hybrid work, better transit, and
safer streets, it’s possible to lock in some of the emissions benefits without locking anyone down.
Not everyone can work from home, and not every job should. But even shifting a slice of commutes can cut peak
traffic, reduce fuel use, and improve air qualityespecially if the vehicles on the road are increasingly
electric and the electricity is increasingly clean.
Lesson C: Efficiency Isn’t BoringIt’s the Cheapest “Fuel”
The cleanest energy is the energy you don’t have to generate. Efficient appliances, better building envelopes,
LED lighting, industrial process optimizationthese don’t sound glamorous, but they consistently deliver
emissions cuts while saving money. Efficiency is the quiet employee who keeps showing up and doing the work
without asking for applause.
A Quick “Number of the Day” Scoreboard (Because Numbers Are Fun)
- 5.8% approximate decline in global energy-related CO2 emissions in 2020.
- ~2 billion metric tons scale of that global CO2 decline in absolute terms.
- 11% decline in U.S. energy-related CO2 emissions in 2020.
- 41% drop in U.S. domestic passenger flights in 2020 vs. 2019.
- ~13% drop in U.S. vehicle miles traveled in 2020 vs. 2019.
- ~414 ppm atmospheric CO2 annual mean at Mauna Loa in 2020, still rising.
Put together, the scoreboard tells a story: emissions can fall quickly when fossil fuel use falls. But the
atmosphere doesn’t “forget” decades of pollution because we had one weird year.
Conclusion: Don’t Romanticize the DropLearn From It
The pandemic stifled CO2 emissions the way a power outage stifles your Wi-Fi: effective, yes, but not a
strategy anyone wants to repeat. The real value of 2020 is what it revealed about leverage points.
Transportation matters. Buildings matter. Clean electricity matters. Efficiency matters. And temporary
slowdowns are not the same thing as durable decarbonization.
If we treat the “Number of the Day” as a climate homework assignment, the answer is pretty clear:
we need sustained emissions cuts driven by cleaner power, smarter infrastructure, and technologies that make
low-carbon choices normalnot heroic.
Experiences People Commonly Associate With 2020’s CO2 Dip (About )
When people think back to the pandemic’s emissions dip, it’s rarely because they were tracking charts.
It’s because daily life felt physically different. The most obvious experience was the commute that
suddenly disappeared. A lot of people can still remember that first Monday when the usual traffic noise
outside their window simply… wasn’t there. Fewer cars meant quieter streets, faster crosswalks, and
(depending on where you lived) the odd feeling of hearing birds that had apparently been auditioning for
years but couldn’t get past the engine sounds.
For many workers, “going to the office” became a short walk to a laptop, a mug of coffee, and a
video-meeting background that tried very hard to hide a pile of laundry. That shift wasn’t just cultural;
it was an emissions shift. Office buildings that normally ran lights, elevators, cooling, and heating for
thousands of people became semi-idle. Meanwhile homes became mini-officesmore daytime electricity use,
more heating or air conditioning, and a new relationship with the phrase “You’re on mute.”
Travel was the other big emotional marker. Canceled flights, postponed weddings, and vacations replaced by
“let’s watch a documentary about beaches.” Airportsusually designed to feel like you’re always latebecame
places people avoided entirely. That experience lines up with the aviation numbers: far fewer flights, and
fewer passengers per plane when flights did happen. Even if you didn’t step into an airport, you probably
felt the ripple effect in quieter skies and fewer contrails overhead.
Shopping habits changed too. With supply chains snarled and stores operating differently, many people bought
less “stuff” and delayed big purchases. Others shifted spending to home improvement, electronics, or comfort
items. Those changes matter because manufacturing, shipping, and warehousing are energy-intensive. When demand
pauses, factories and freight don’t run at the same intensity. When demand rebounds, they ramp back up.
That’s one reason emissions came back so quickly: the underlying system was still built around fossil energy.
Another common experience was noticing the difference between “cleaner air” and “solving climate change.”
People saw clearer skies and assumed that meant the climate problem was easing, when the reality is more
complicated. Short-lived pollutants can drop fast when traffic drops. CO2 doesn’t behave that way. It’s
more like a long-term ledger than a daily receipt. The pandemic year didn’t erase the past; it briefly
changed the pace at which the future was being written.
Finally, a lot of people came out of 2020 with a new sense of what’s possible. Not because the year was fun
(it wasn’t), but because it proved systems can change quickly when they have to. The climate challenge is
to create that kind of change deliberately and humanelythrough technology, infrastructure, and policyso the
next big emissions drop comes from smarter design, not global disruption.